
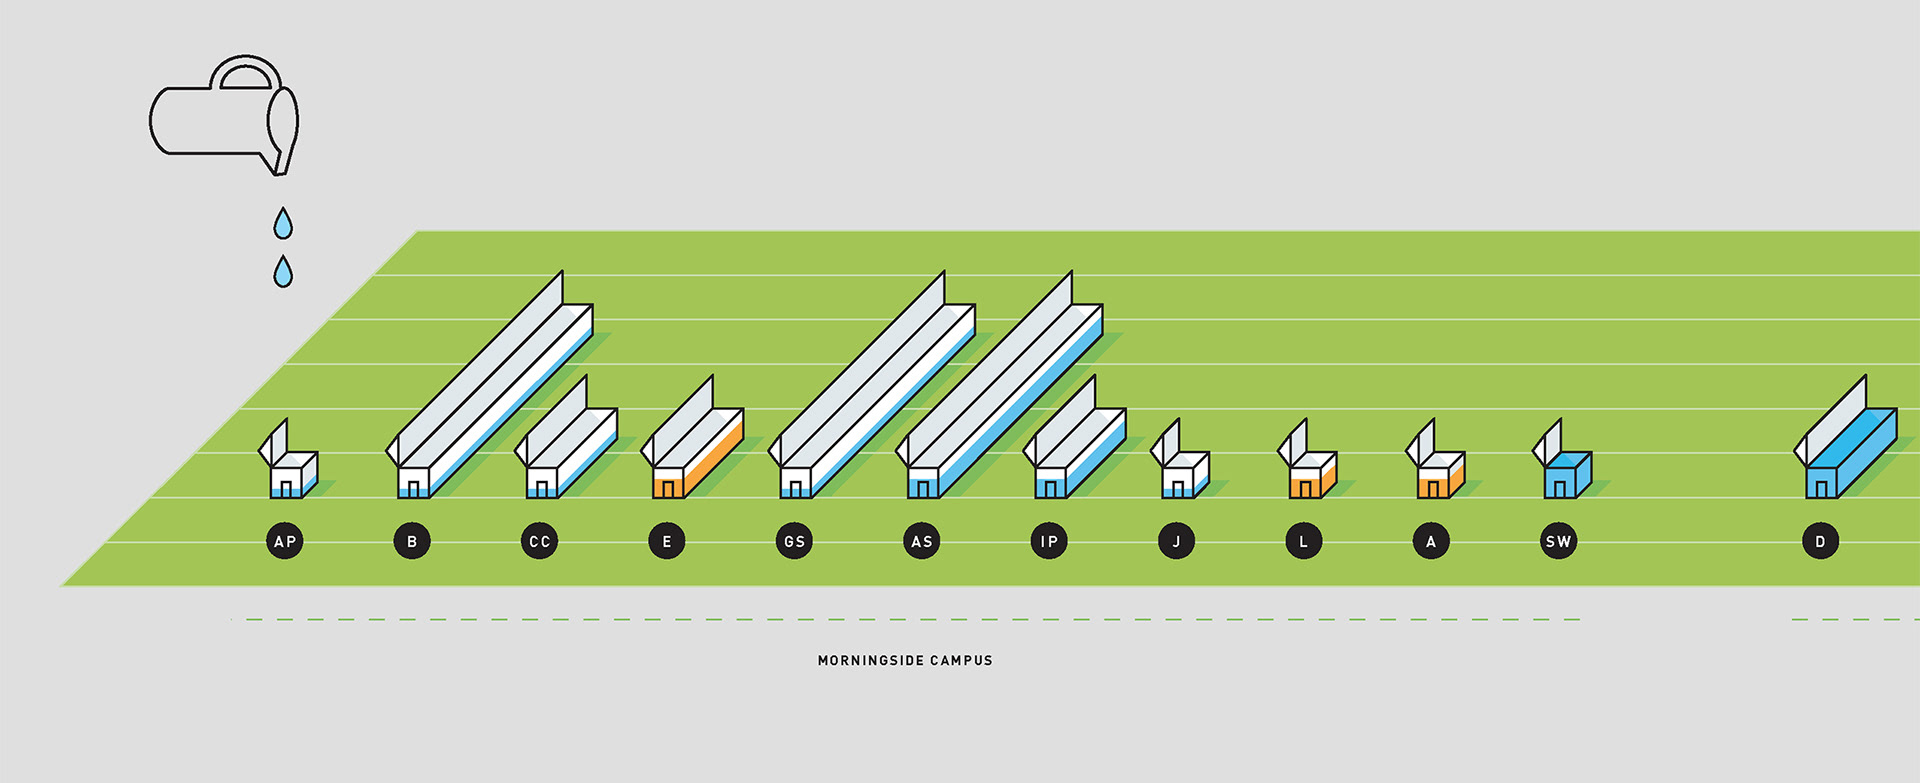
This chart was originally designed for the Columbia Center for New Media Teaching and Learning (CCNMTL) — now called the Columbia Center for Teaching and Learning
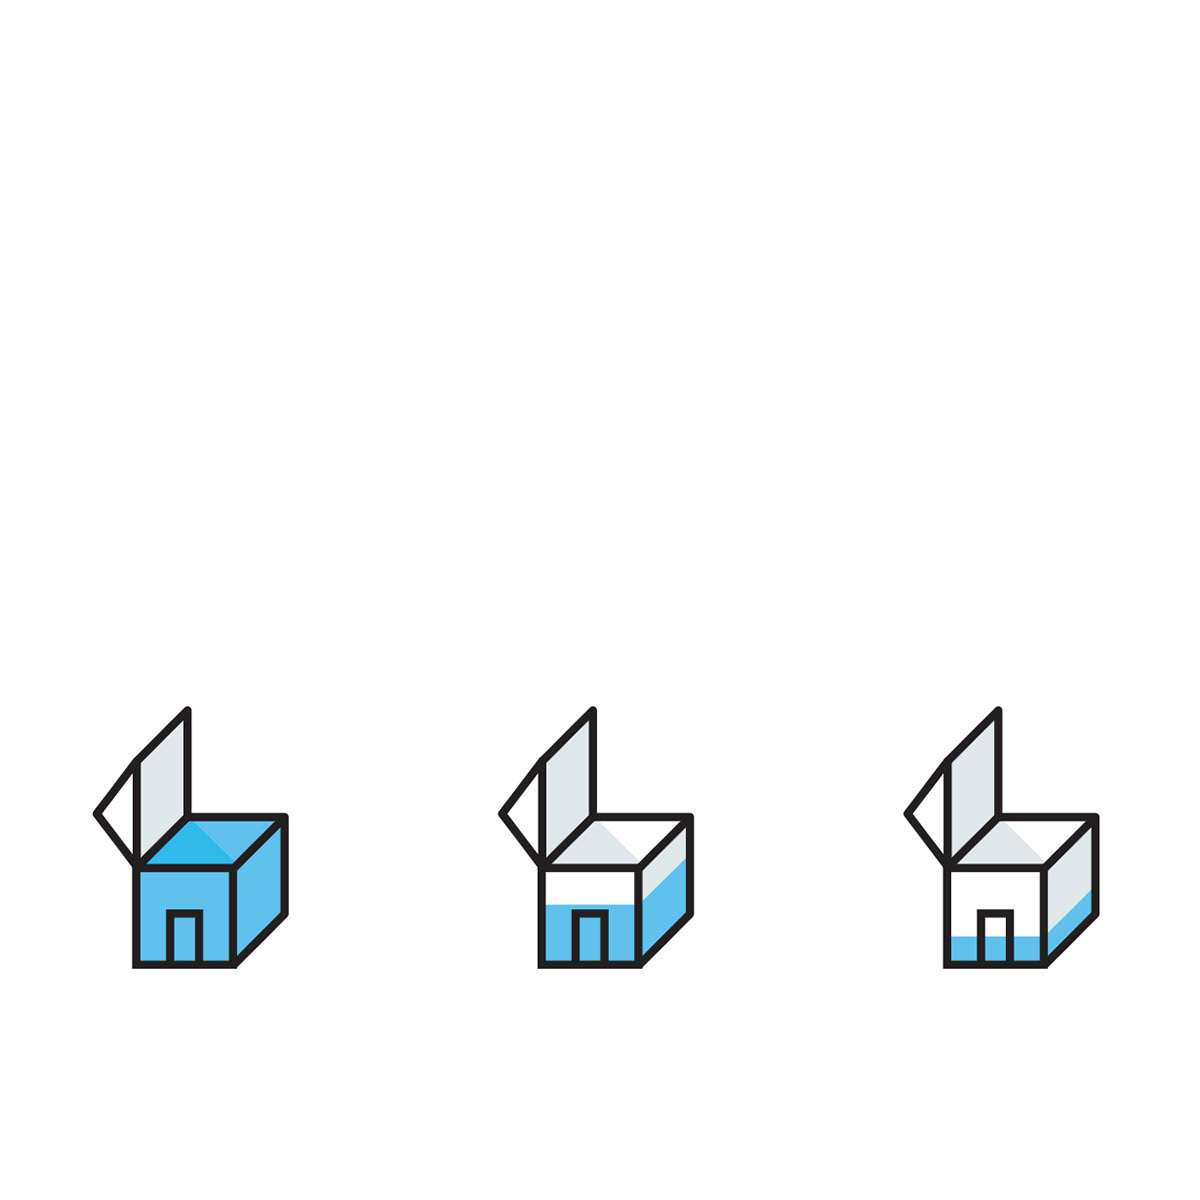
Three variables organize the content (1) size of schools (2) levels of CCNMTL engagement and (3) impact amount (shown through color differentiation — orange and blue)
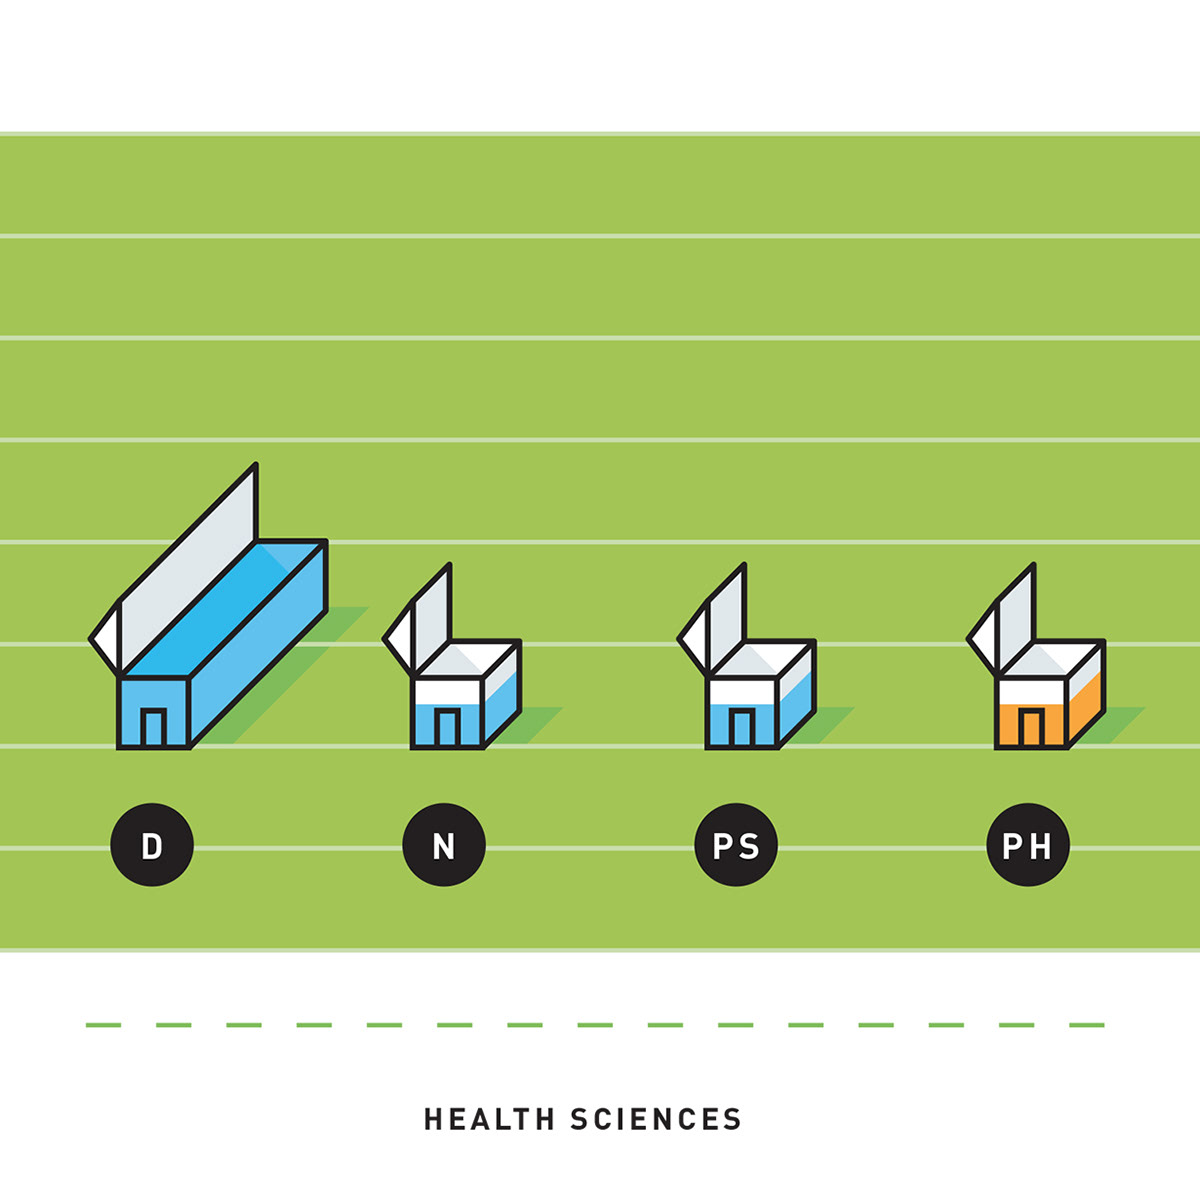
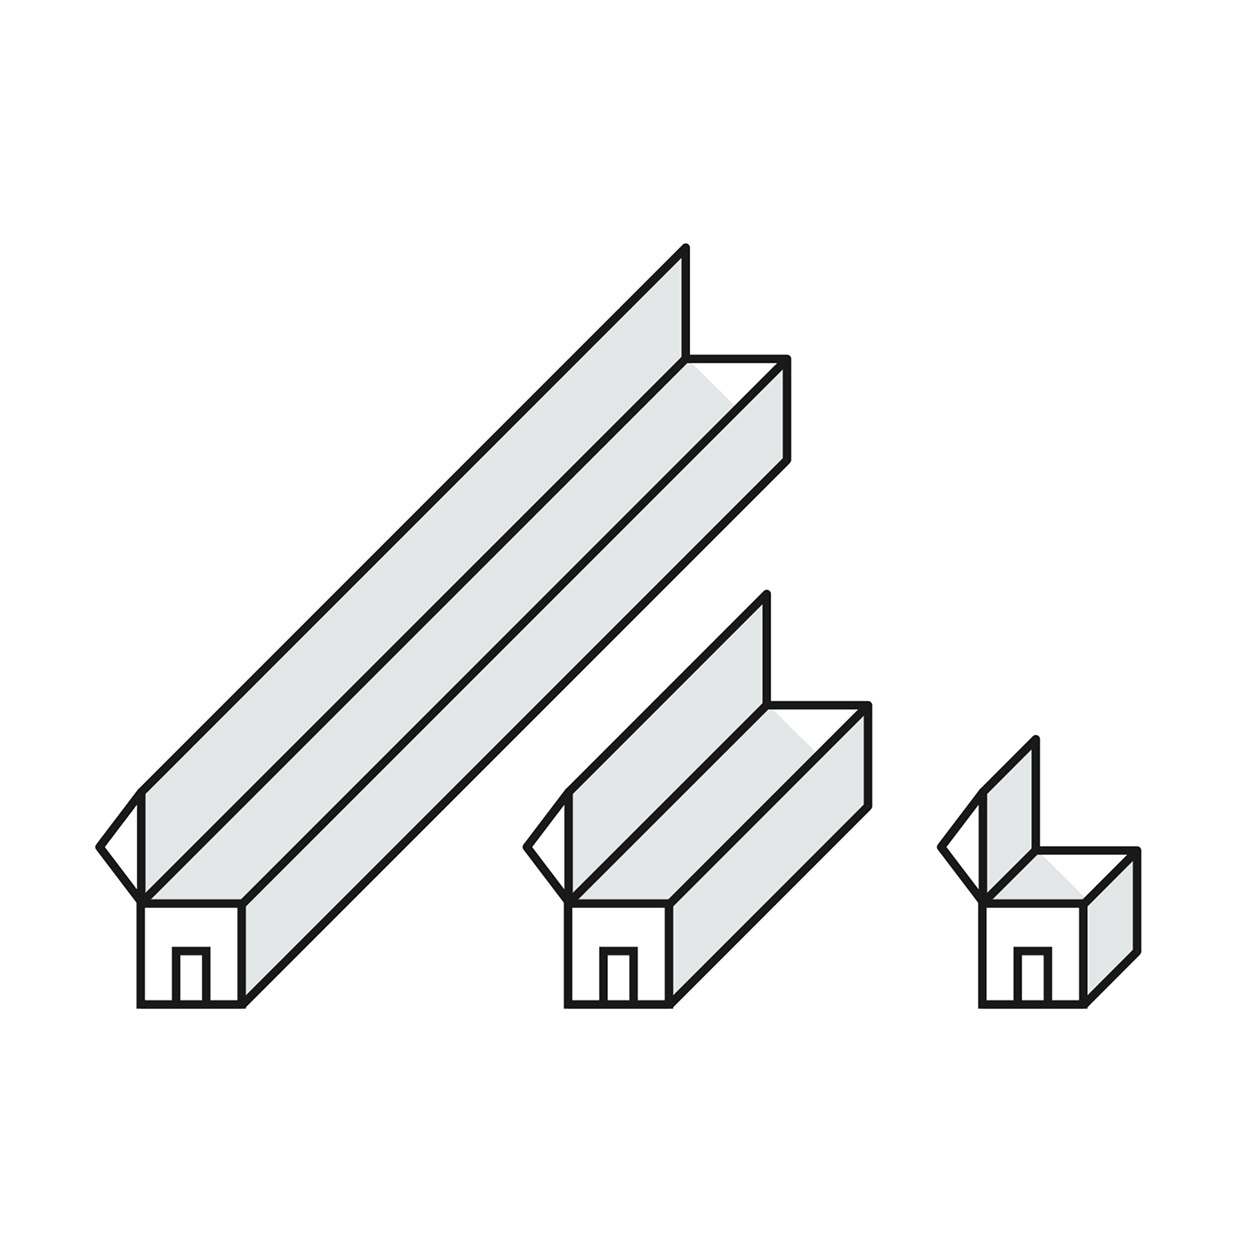
The building serves as a metaphor for both school and knowledge
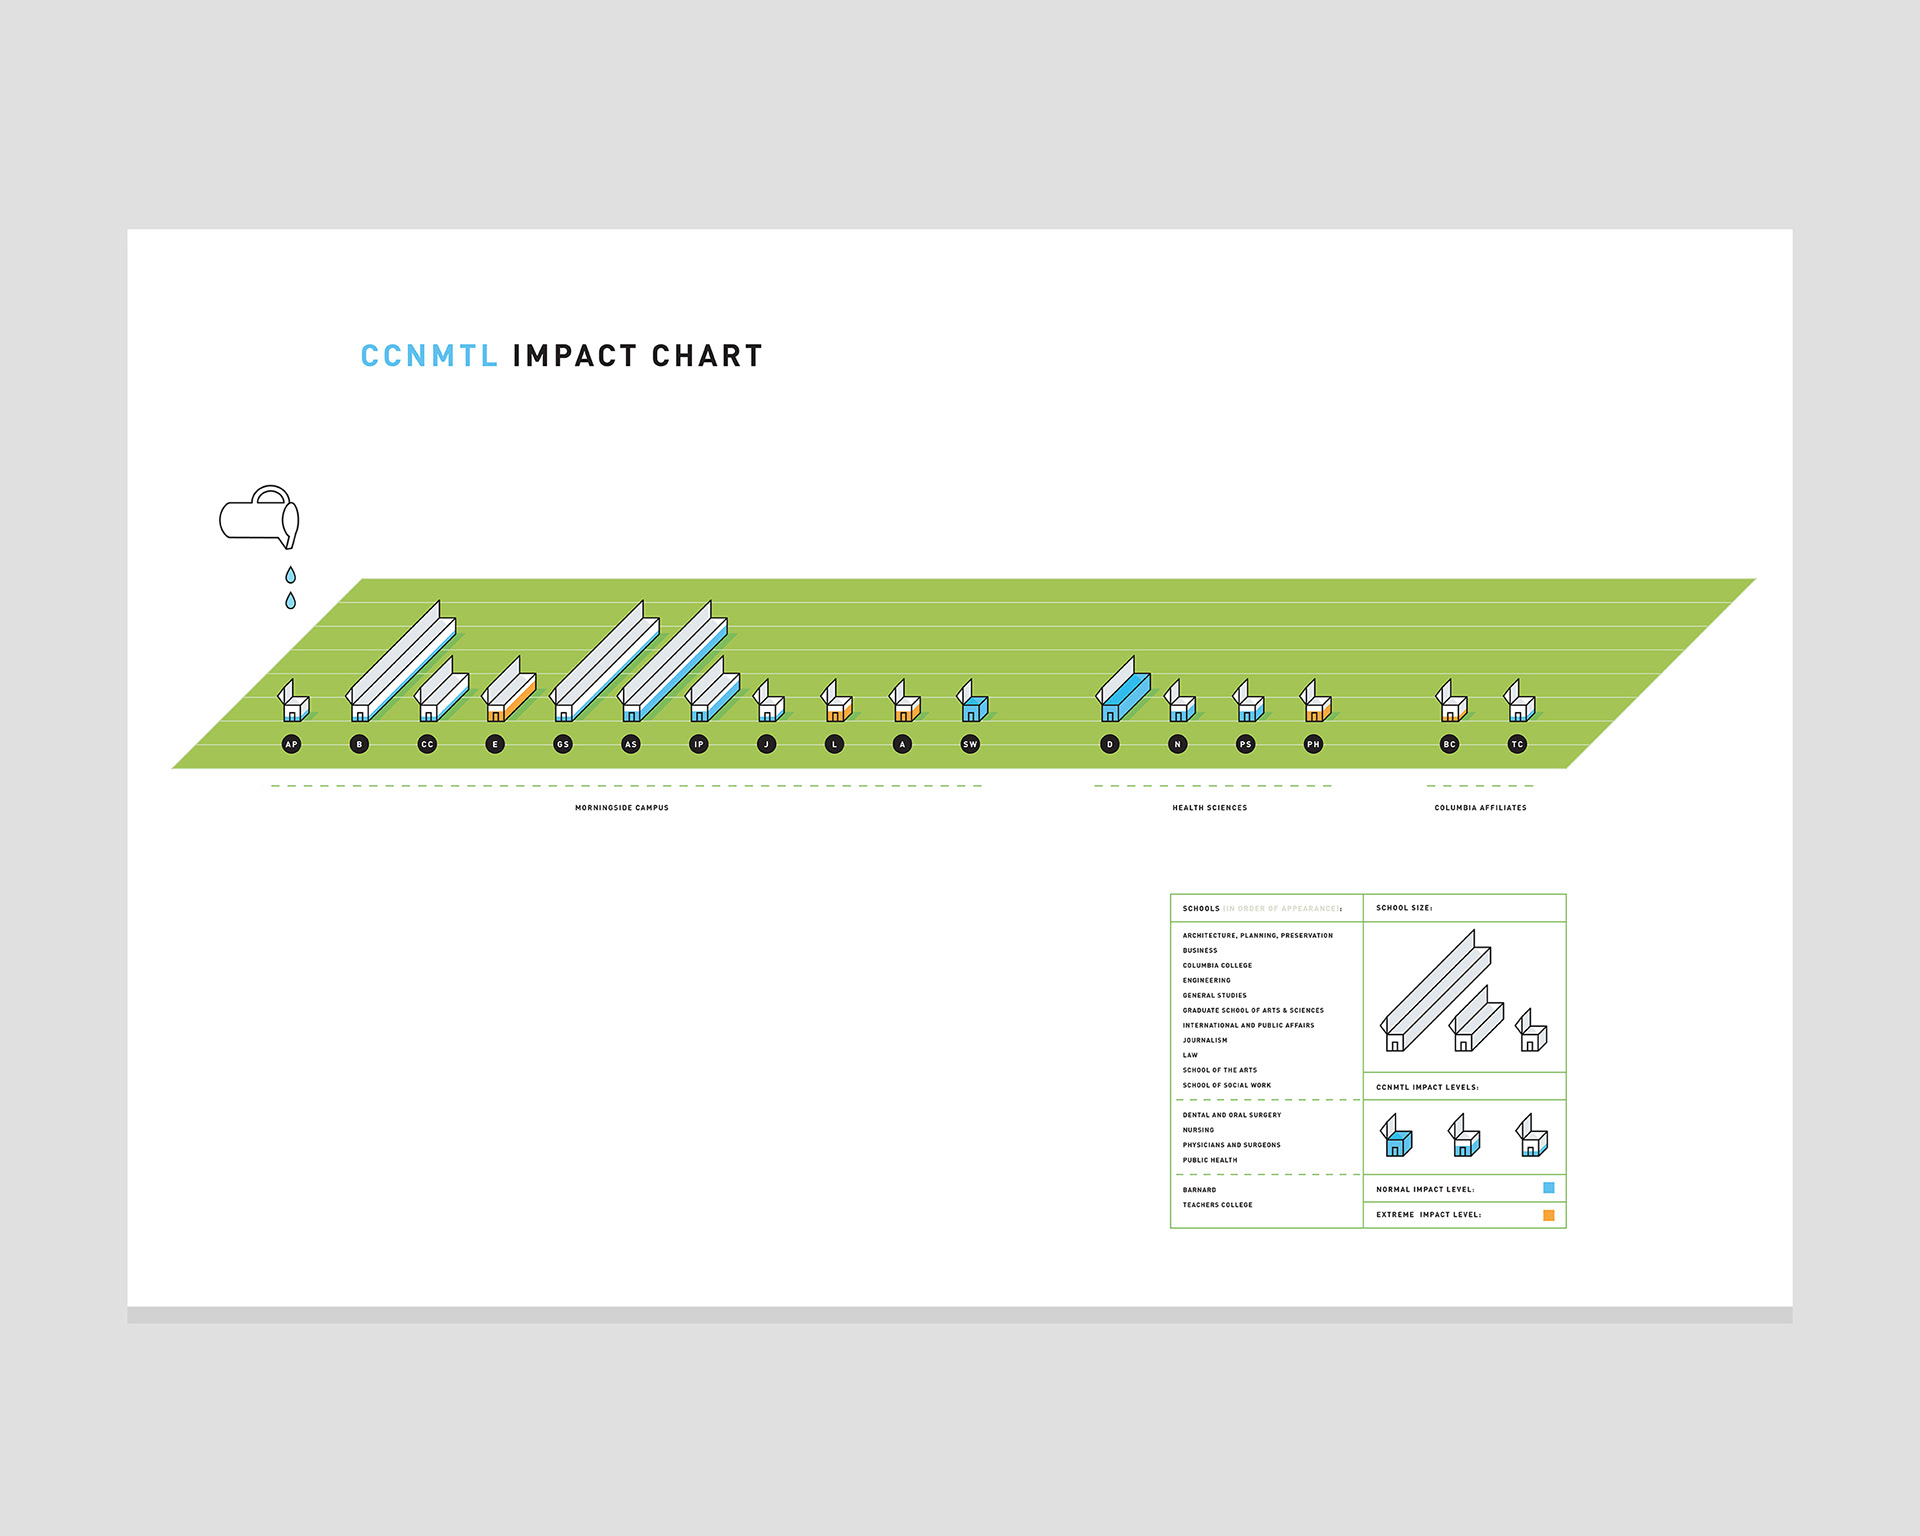
This chart is able to be used digitally and in print.
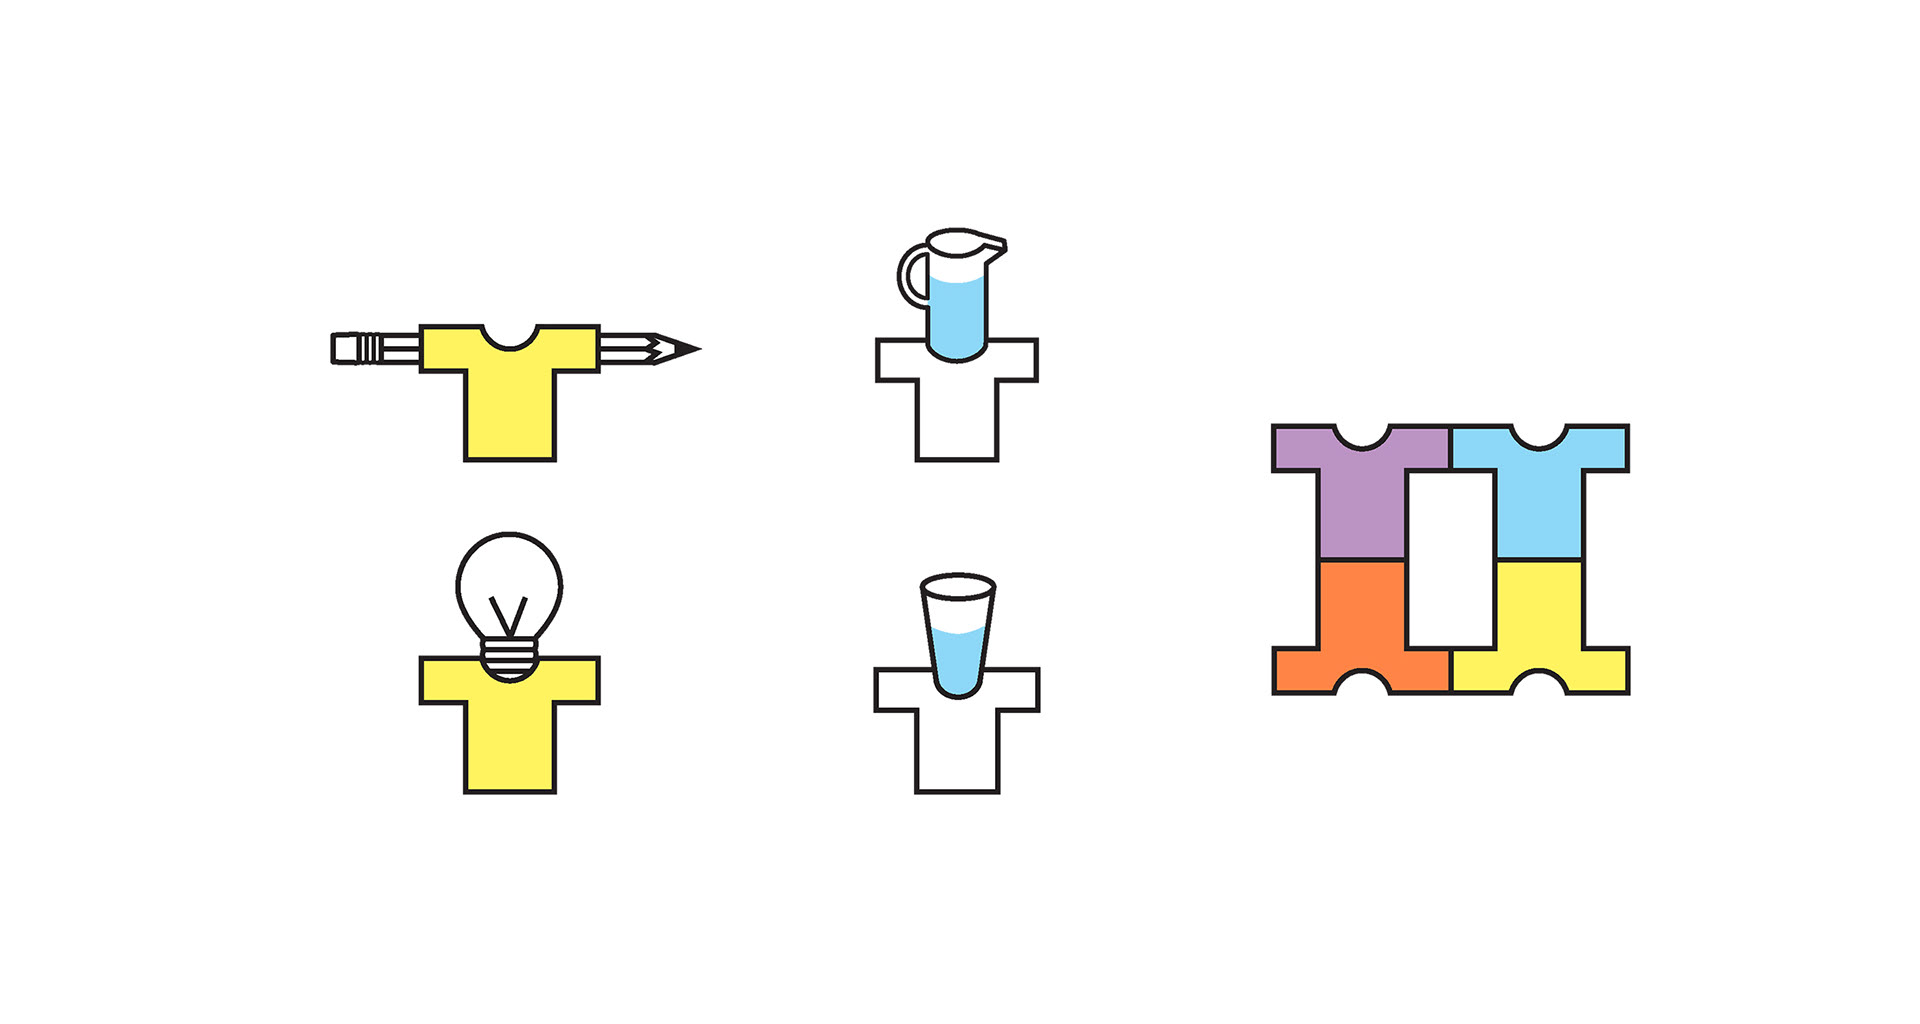
Early icon studies. The middle column uses problematic metaphors for learning and so was eliminated
Client:
Columbia Center for New Media Teaching and Learning (CCNMTL)
Columbia Center for New Media Teaching and Learning (CCNMTL)